This web page was produced as an assignment for Genetics 564, an undergraduate capstone course at UW-Madison.
What is Transcriptomics? [1]
Transcriptomics is the technique utilized to quantify all RNA transcripts, also known as the study of the transcriptome. By measuring the gene expression through RNA transcripts, researchers can gain important information on how genes are regulated or other important cellular functions. Transcriptomic analysis has allowed gene expression changes to be analyzed in different organisms. This can be done through microarray, RNA sequencing, or qt-PCR. Through these analyses, researchers can apply this understanding to human disease.
What is Microarray? [2]
|
A microarray analysis involves a comparison of mRNA molecules retrieved from experimental data and from reference data. The reference sample usually utilizes a healthy or wild type organism and compares the diseased organism of interest. These two samples of mRNA are then converted to complementary DNA (cDNA) and labeled with a different fluorescent probe for each sample. These cDNA are then mixed and bind to a microarray chip. The chips are then scanned to measure the expression of each gene. An example of this protocol is shown to the right (Figure 1). The data gathered through this process can show the changes in gene expression.
|
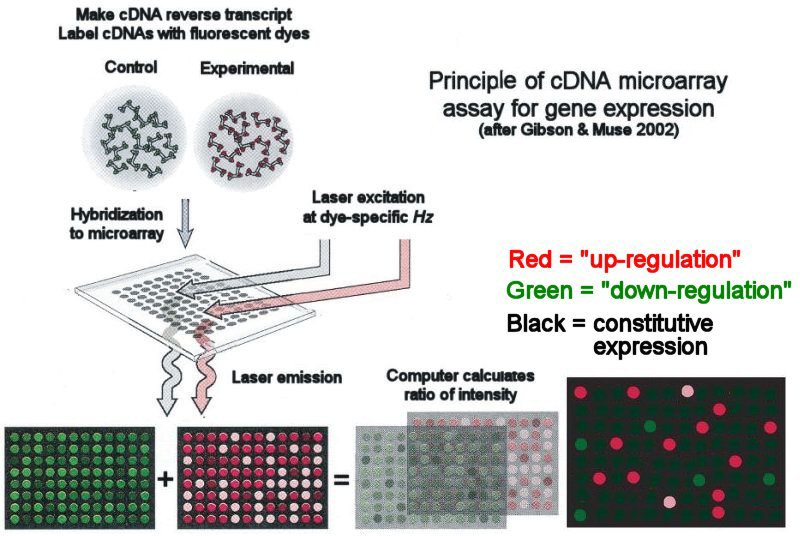
Figure 1: Microarray Analysis
|
What is RNA Sequencing? [3]
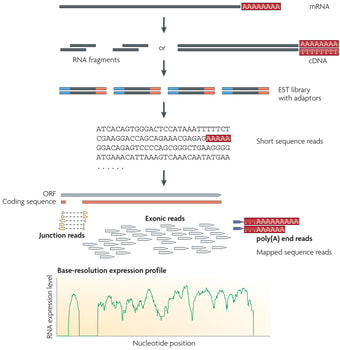
Figure 2: RNA Sequencing Method
|
RNA sequencing involves converting long RNAs into cDNAs through fragmentation. Adaptors are then added to each cDNA fragment and a sequence is obtained from each cDNA. The sequence reads are aligned with a reference genome or transcriptome. RNA-Seq is especially useful for looking at genomic sequences from non-model organisms and can show very little background noise compared to other methods. Overall, this method can provide quantitative results when analyzing the transcriptome.
|
What Can Transcriptomics Do for FUS Research? [4]
By comparing transcriptomes in cell populations, important information can be discovered on upregulated or downregulated biological pathways. In this specific study, I am focused on finding the molecules involved in FUS-mediated DNA repair in motor neurons. By creating specific mutations in FUS, you can compare the transcriptomes of wild type FUS to the specific mutations of interest. This information can provide important functions that are disrupted by mutant FUS.
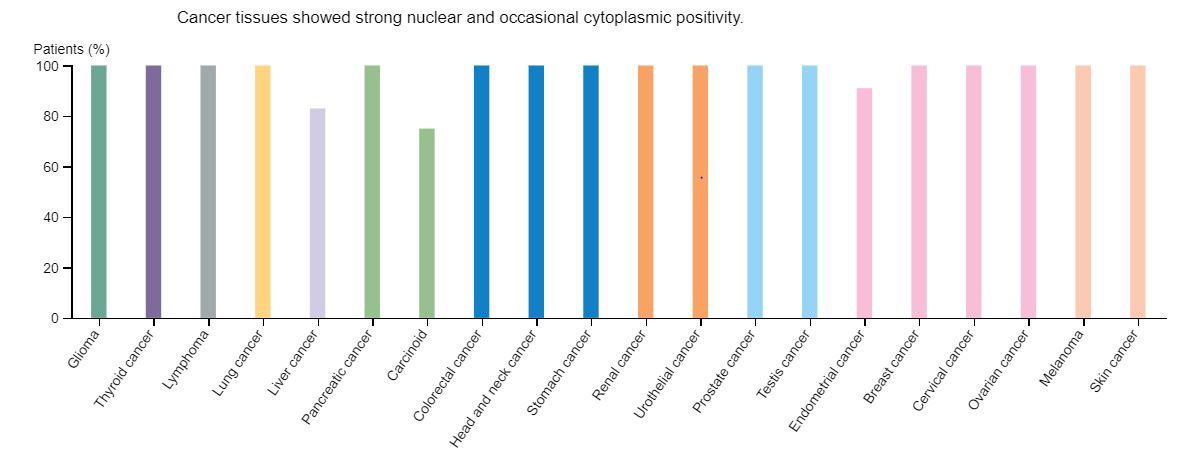
Figure 3: Cancer Profiles of FUS Expression
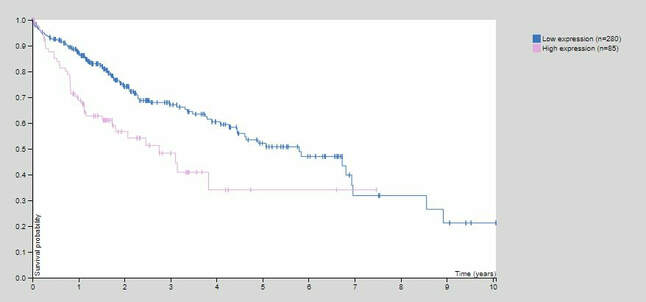
Figure 4: FUS Expression in Liver Cancer
The Human Protein Atlas provides cellular localization, protein expression, and gene expression in various tissues, including FUS. By using this program, I was able to identify the role of FUS in cancer development in multiple cancer types. It was not surprising to see that this gene was upregulated in almost all cancer types, including glioma, or cancerous glial cells (Figure 2). I think the most interesting finding was that the expression of FUS was correlated with unfavorable outcomes in liver cancer (Figure 3). In addition, GEO Profiles provided an example of FUS being upregulated in oxidative stress induced neurodegeneration. DNA repair mechanisms are implicated with DNA repair mechanisms and this result may suggest that FUS-related mechanisms may also be at play. From these preliminary findings, this suggests that there may be an additional FUS-related DNA repair mechanisms that can explain these results given that cancer rarely occurs in FUS-related ALS.
Tissue Expression of FUS [4]
The Human Protein Atlas also provided the normal expression of FUS throughout different tissue types shown in. The highest areas of expression were muscle, immune systems, and brain structures. Surprisingly, there was a high expression of FUS in female tissues similar to those involved with motor neurons. The protein structure was also similar across all tissues types showing localization in the nucleus. It is unclear why ovarian tissues would contain higher RNA expression levels.
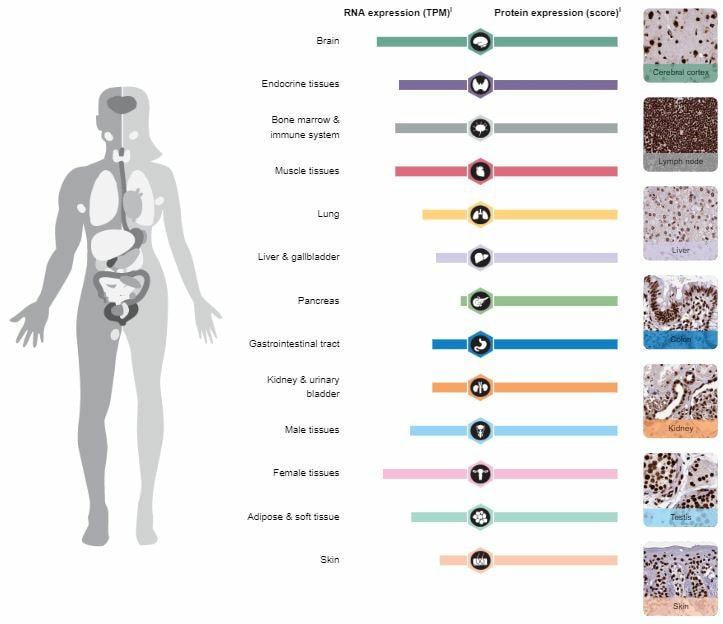
Figure 5: Human Protein Atlas RNA and Protein Expression of FUS
Conclusion
Transcriptomics helps provide important information on the expression of genes involved with specific mutations. By comparing transcriptomes across wild-type, mutant organisms, and tissue type, individuals can utilize this information to help detail important biological pathways. Currently, there is limited data from GEO Profiles and GEO Datasets for FUS mutations and neurodegeneration. By conducting a microarray analysis, transcriptomics could be used to identify the molecules played in FUS-mediated DNA repair and neurodegeneration.
References
1. Lowe, R., Shirley, N., Bleackley, M., Dolan, S., & Shafee, T. (2017). Transcriptomics technologies. PLOS Computational Biology, 13(5), doi:10.1371/journal.pcbi.1005457
2. Microarray. (n.d.) Retrieved on 3/4/2019 from https://www.nature.com/scitable/definition/microarray-202
3. Wang, Z., Gerstein, M., & Snyder, M. (2009). RNA-Seq: a revolutionary tool for transcriptomics. Nature reviews. Genetics, 10(1), 57-63.
4. FUS. (n.d.) Retrieved on 3/4/2019 from https://www.proteinatlas.org/ENSG00000089280-FUS/pathology
Header Image: https://www.evolving-science.com/health/inhalable-mrna-00895
Figure 1: https://www.mun.ca/biology/scarr/cDNA_microarray_Principle.jpg
Figure 2: https://www.ncbi.nlm.nih.gov/pmc/articles/PMC2949280/
Figure 3: https://www.proteinatlas.org/ENSG00000089280-FUS/pathology
Figure 4: https://www.proteinatlas.org/ENSG00000089280-FUS/pathology/tissue/liver+cancer
Figure 5: https://www.proteinatlas.org/ENSG00000089280-FUS/tissue
