This web page was produced as an assignment for Genetics 564, an undergraduate capstone course at UW-Madison.
What is Phylogenetics? [1]
Phylogenetics is the discovery of genetic relationships between species through specific characters under the belief that similar species are genetically close. Classic phylogenetics deals mainly with the physical characteristics of the organisms being the size, color pattern, presence of tail, or other features. Modern phylogeny utilizes the genetic information via DNA or protein sequences to determine relationships by comparing conserved regions. The easiest way of conveying this information is by using a phylogenetic tree. Phylogenetic trees can be constructed in many ways. Figure 1 highlights the different parts associated with a phylogenetic tree. Each external node refers to a specific species, while internal nodes show common ancestors of species. Each branch refers to the the evolutionary distance of the species from the node or root of the tree. These phylogenetic trees can be made into several different types. These tree types are explained in the section below.
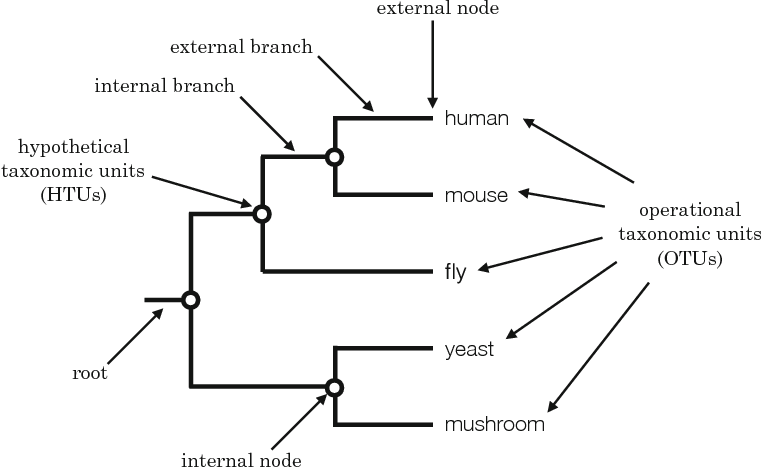
Figure 1: Detailed Phylogenetic Tree
Methods for Constructing Phylogenetic Trees [2]
Maximum Likelihood
This method uses each position in an alignment and evaluates all possible trees. This approach calculates the likelihood for each possible tree that can account for the conversion of one sequence into another and chooses the one with the highest maximum likelihood. This is determined by calculating the likelihood of each specific site on the tree and weighing the probability that the evolutionary model for that has lead to the data provided. The likelihoods for each location are multiplied to provide the overall likelihood for each tree. This method is the slowest and requires the most computation, yet is regarded as the best and the most informative of tree types.
Neighbor Joining
This type of algorithm evaluates each sequence for being neighbors. The sum of all branches length are calculated and the pair with the lowest value is considered the closest neighbors. A new branch is then inserted and the branches are recalculated. This process continues until the tree is complete. This method is rapid, but produces only one tree when resolved. As a result, this process neglects other possible trees and other errors associated with distance can lead to bias.
Minimum Evolution
This method seeks the tree with the smallest sum of branch lengths. This approach achieves this goal by fixing the internal nodes, while using the distance to external nodes to optimize the internal branch lengths. This type works best in distance-based methods, but works more slowly than the Neighbor Joining method. Often, this process yields a similar tree as the Neighbor Joining method.
How to Make a Phylogenetic Tree:
Step 1: Data Collection
To make a phylogenetic tree you must first collect the protein sequence or DNA sequence from each specific species of interest. Next, find all protein homologs in FASTA format and place them in a .txt file (Figure 2). It also important to use a simplistic organism name like "Homo sapiens (Human)" to be shown on the tree.
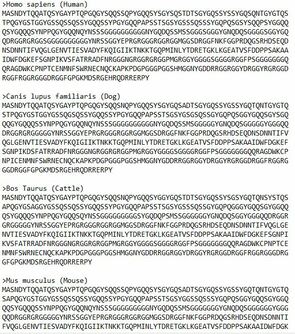
Figure 2: Protein homologs of FUS in FASTA format.
Step 2: Sequence Alignment
The next step is to align the sequences in MEGA or ClustalOmega in order to generate your tree. Details on how to generate the alignments can be found on their respective website links. The figure below shows the aligned format of the protein across several species contain a homolog of FUS (Figure 3). Conserved amino acids across all species are notified by a black asterisk in the first row.
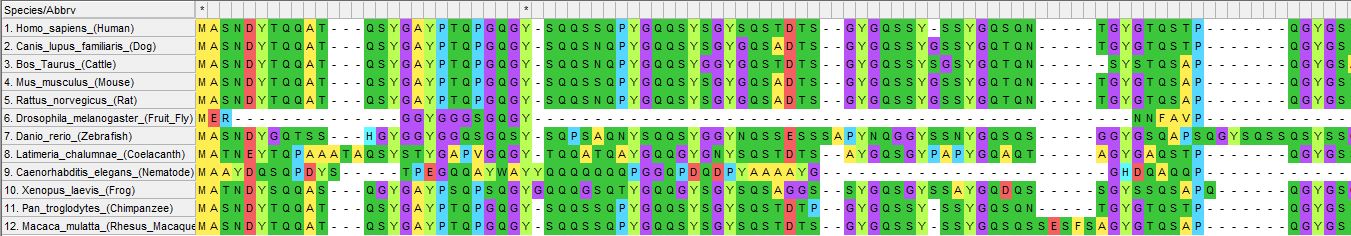
Figure 3: Sequence alignment of FUS in MEGA across many species.
Step 3: Tree Construction
Utilizing the same programs above, this data can be used to create several types of trees based on different scoring algorithms. Below are several examples of phylogenetics trees including: Maximum Likelihood, Neighbor Joining and Minimum Evolution.

Figure 4: Maximum Likelihood Tree of FUS Homologs
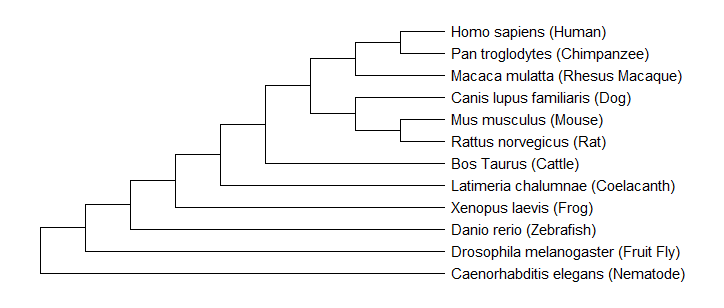
Figure 5: Neighbor Joining Tree of FUS Homologs
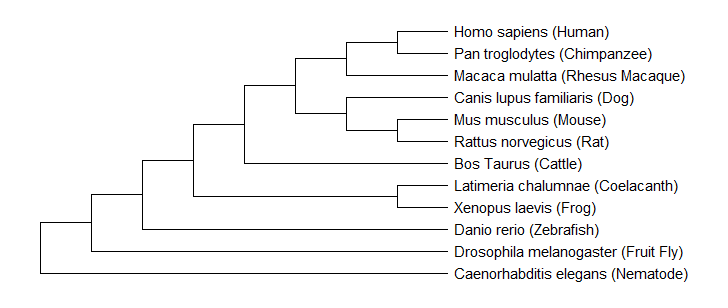
Figure 6: Minimum Evolution Tree of FUS Homologs
Conclusion
As a whole, the three trees shown above suggested that C. elegans were the outliers of the analysis and were proposed to have diverged first. The most interesting observation was that all three trees predicted the same evolutionary relationships for two subgroups. One group contained humans, chimpanzees, and rhesus macaques. The other group consisted of mice, rats, and dogs. At some point over evolutionary history, there was a clear branching point that divided these groups and led to slight differences shown in the protein sequences. These results suggest that non vertebrates with nervous systems diverged first, followed by vertebrates, and then mammals. Overall, there was high similarity shown between mammals of this important regulatory protein. In conclusion, the trees showed a similar evolutionary pattern, which may reflect the original progression of the FUS protein throughout species.
References
1: Shamir, R. Algorithms for Molecular Biology. Retrieved on March 2, 2019 from https://www.cs.tau.ac.il/~rshamir/algmb/archive/phylogeny_corrected.pdf
2: Li, Y. How to Build a Phylogenetic Tree. Retrieved on March 2, 2019 from http://guava.physics.uiuc.edu/~nigel/courses/598BIO/498BIOonline-essays/hw2/files/hw2_li.pdf
Figure 1: Retrieved from https://ai2-s2-public.s3.amazonaws.com/figures/2017-08-08/f21b0ff686bfb864720772fd5b4ad22dde9ddc78/3-Figure1-1.png
Figure 2-6: Created by Nathan Johnson
